Algorithms of Signal Processing
 Pulse oximeters measure and display the oxygen
saturation of hemoglobin in arterial blood, volume of individual blood
pulsations supplying the tissue, and the heart rate.
Pulse oximeters measure and display the oxygen
saturation of hemoglobin in arterial blood, volume of individual blood
pulsations supplying the tissue, and the heart rate.
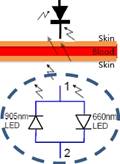
DDL2002/DDN2090 series of APMKorea shine light through the tissue that is perfused with blood such as a finger, an ear, the nose or the scalp, and photo-electrically sense the recorded as an electric signal. The signal is then processed using several signal processing algorithms to estimate the aterial oxygen saturation reliably in the presence of motion and other artifacts.. Signal-processing algorithms implemented both in hardware and software play a major role in transforming the signals that are collected by the sensors and extracting useful information. ECG synchronization algorithms that enhance the reliability of SaO2 estimation and improve the signal-to-noise ratio.
Sources of Errors
The three general sources of errors dealt with by signal-processing algorithms are the motion artifact, reduced saturation levels (<80%) and low perfusion levels. The motion artifact is a major problem that is usually due to the patient’s muscle movement proximate to the oximeter probe inducing spurious pulses that are similar to arterial pulses. The spurious pulses when processed can produce erroneous results. The problem is particularly significant in active infants, and patients that do not remain still during monitoring. The quantity of motion required to disturb the signal is very small. Shivering and slight flexing of the fingers can make the signal erroneous.
Another significant problem occurs in circumstances where the patient’s blood circulation is poor and the pulse strength. For example, poor circulation occurs in case of insufficient in very weak. In such conditions, it is difficult to separate the true pulsatile component from artifact pulse because of the low signal-to-noise ratio. Several time-domain and frequency-domain signal-processing algorithms are proposed to enhance the performance of pulse oximeters with improved rejection of noise, spurious pulses, motion artifact, and other undesirable aperiodic waveforms.
Algorithms
 Pulse oximetry
measures the effect of arterial blood in tissue on the intensity of the transmitted
light. The volume of blood in the tissue is a function of the arterial pulse,
with a greater volume present at systole and a smaller volume
present at diastole. Because blood absorbs most of the light passing through
the tissue, the intensity of the light emerging from the tissue is inversely
proportional to the volume of the blood present in the tissue. The emergent
light intensity varies with the arterial pulse and can be used to indicate a
patient’s pulse rate. In addition, the absorbance coefficient of oxyhemoglobin is different from that of deoxygenated
hemoglobin for most wavelengths of light. Differences in the amount of light
absorbed by the blood at two different wavelengths can be used to indicate the
hemoglobin oxygen saturation, which equals
Pulse oximetry
measures the effect of arterial blood in tissue on the intensity of the transmitted
light. The volume of blood in the tissue is a function of the arterial pulse,
with a greater volume present at systole and a smaller volume
present at diastole. Because blood absorbs most of the light passing through
the tissue, the intensity of the light emerging from the tissue is inversely
proportional to the volume of the blood present in the tissue. The emergent
light intensity varies with the arterial pulse and can be used to indicate a
patient’s pulse rate. In addition, the absorbance coefficient of oxyhemoglobin is different from that of deoxygenated
hemoglobin for most wavelengths of light. Differences in the amount of light
absorbed by the blood at two different wavelengths can be used to indicate the
hemoglobin oxygen saturation, which equals
% SaO2 = [HbO2] /([Hb] + [HbO2]) X 100%
Spectral Methods of
Estimating SpO2
Aretial oxyhemoglobin saturation (SpO2) values are currently computed using weighted moving average (WMA) techniques. These methods process the time domain signals and give a precision of no better than ±2% (±one standard deviation). Other digital processing algorithms for improved estimation of SpO2 is the fast Fourier transform (FFT) and discrete cosine transform (DCT) were identified as potentially superior algorithms and useful to optimize the portability of pulse oximetry systems. Preliminary studies indicate that a 64-point FFT, with a 15Hz sample rate, over a data collection period of 4.3 second was found to be the optimal combination for pulse oximetry applications, minimizing hardware expense, footprint, and power consumption. SpO2 values were calculated from a transform size of 64 points using
SpO2 = 110 - 25 X
R
Where R is the ratio of the red and infrared normalized transmitted light intensity. The R value is
R = [ACred
/ DCred] / [ACir
/ DCir]
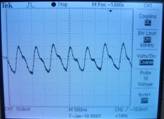
The AC component is the signal variation at the cardiac frequency and the DC component is the average overall transmitted light intensity. The AC component is selected as the highest spectral line in the cardiac frequency band.